
PeqApps
Capture File Forensics
Amplification Attacks, SYN Floods, Ping Sweeps, Port Scans, Checksum Errors, Duplicate IP Addresses, Segment Gaps, LAND Attacks, ARP Request Storms, Extraneous Data, Null Scans, Ping Floods, Zero Windows, …
Are they lurking in your capture files? Find out with Capture File Forensics.
“Its biggest advantage was that it was supremely easy to use.”
Len Shustek on the Sniffer
The Return of Easy to Use Network Analysis


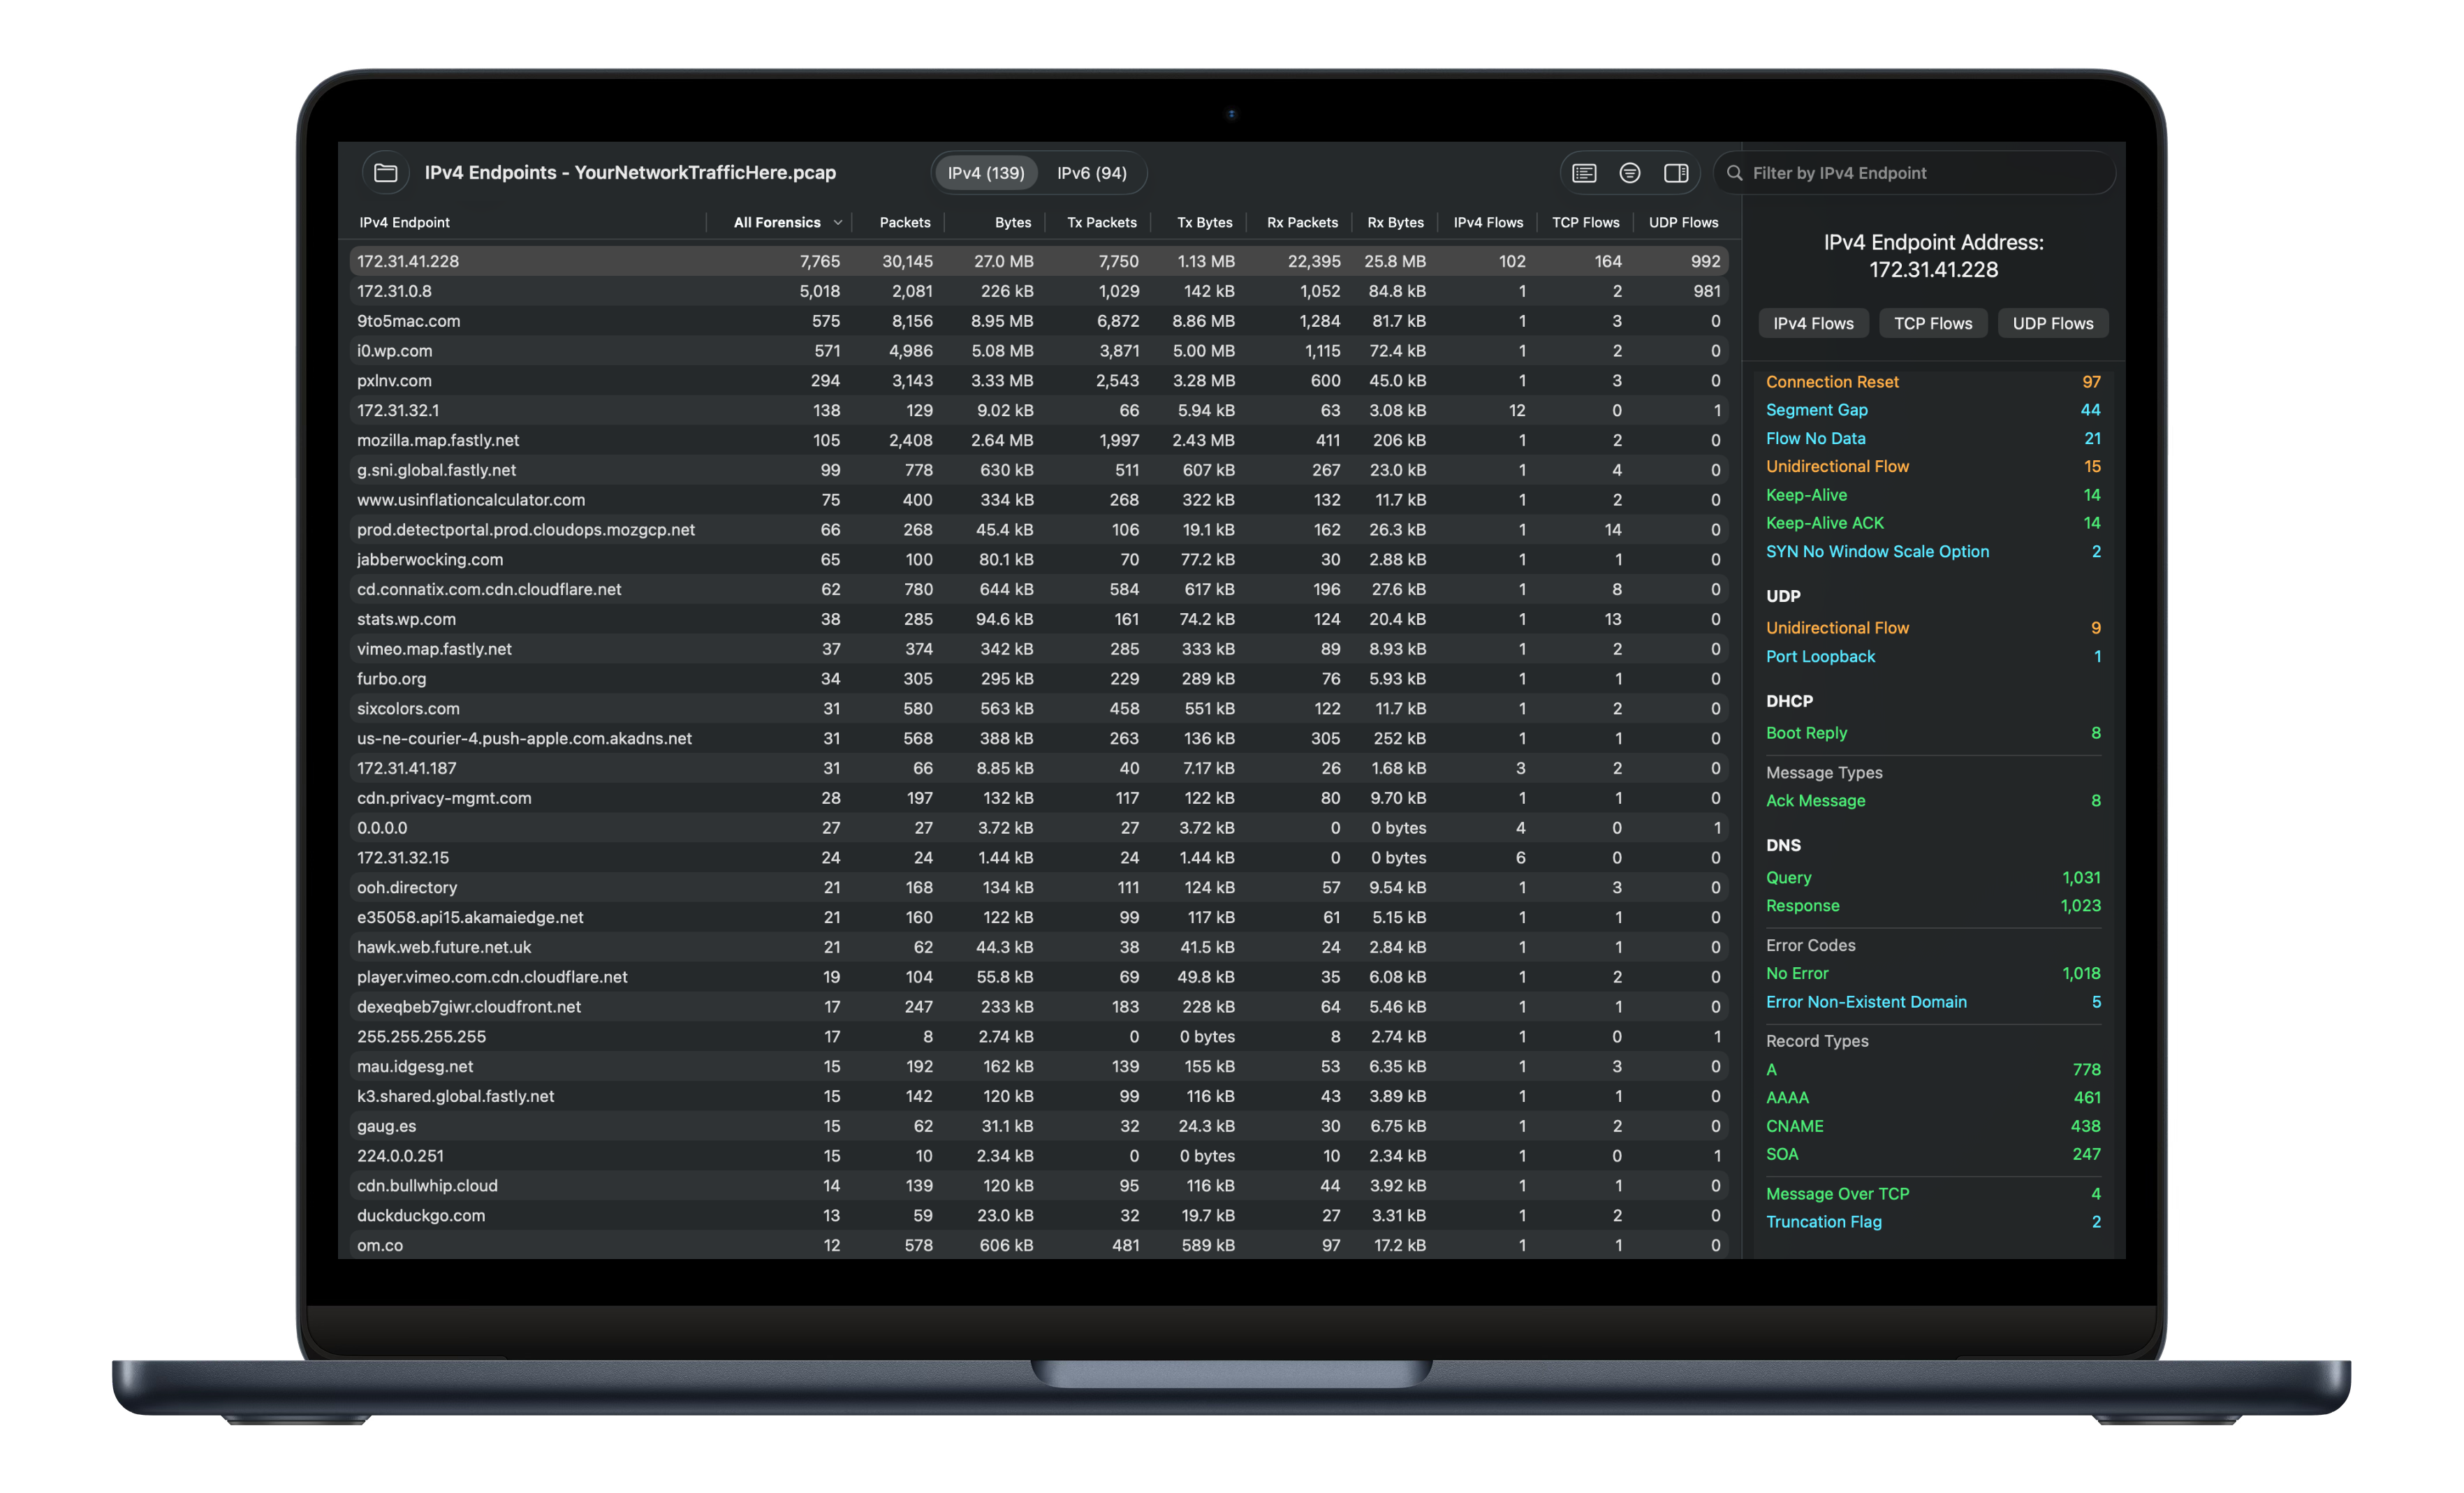
Capture File Forensics quickly and easily extracts network forensic information from capture files. When a capture file is loaded, CFF analyzes all packets in the file and creates the following tables:
+
IP Endpoints (IPv4 and IPv6)
+
IP Flows (IPv4 and IPv6)
+
TCP Flows
+
UDP Flows
IP Endpoints: Lists activity for all IP addresses. Selecting a row displays an endpoint detail view (as shown on the left) with forensics, protocol distributions, and drill-down to IP, TCP, and UDP flows.
IP Flows: The IP Flows button is available in the IP Endpoint Detail view. Clicking the button displays a table listing activity between the endpoint and all other IP Endpoints. Selecting a row displays a flow detail view with forensics, protocol distributions, and drill-down to TCP and UDP flows.
TCP Flows: The TCP Flows button is available in the Endpoint Detail and IP Flow Detail views. It displays a table listing activity for TCP 4-tuples (IP address pairs and TCP port pairs) associated with the endpoint or flow. Selecting a row displays a detail view with forensics and flow details. Since TCP is connection-oriented, the table can list multiple rows for the same 4-tuple, with the “Reused Port Number” forensic item present when this occurs.
UDP Flows: The UDP Flows button has the same characteristics for UDP as the TCP Flows button does for TCP, with the exception that there can’t be multiple rows with the same 4-tuple since UDP is not connection-oriented.
Supported capture file formats
+
pcap
+
pcap.gz
+
pcapng
+
pcapng.gz
+
Microsoft NetMon 2.x
+
Sun snoop
+
Network General Sniffer (DOS)
Supported link-layer header types
+
Ethernet
+
Token Ring
+
Frame Relay
+
FDDI
+
PPP
+
Cisco HDLC
+
Linux “cooked”
+
Linux “cooked” v2
+
Linux Netlink
+
Linux ATM CLIP
+
Raw IP
+
Raw IPv4
+
Raw IPv6
+
Solaris IPNET
+
NULL/Loopback
+
IP over IB
+
Per-Packet Information header
+
Broadcom tagged Ethernet
+
Marvell DSA tagged Ethernet
+
Marvell EDSA tagged Ethernet
Supported network forensic information
The current release of CFF supports 308 forensic information elements, 56 of which are displayed in the IPv4 Endpoint Detail view shown on the left. CFF currently supports information elements for the ARP, DHCP, DHCPv6, IPV4, IPv6, ICMP, ICMPv6, TCP, UDP, DNS, MDNS, LLMNR, and Telnet protocols and the traceroute command. The full list of information elements can be reviewed here and, within the app, across the seven Forensics tabs in CFF Settings:
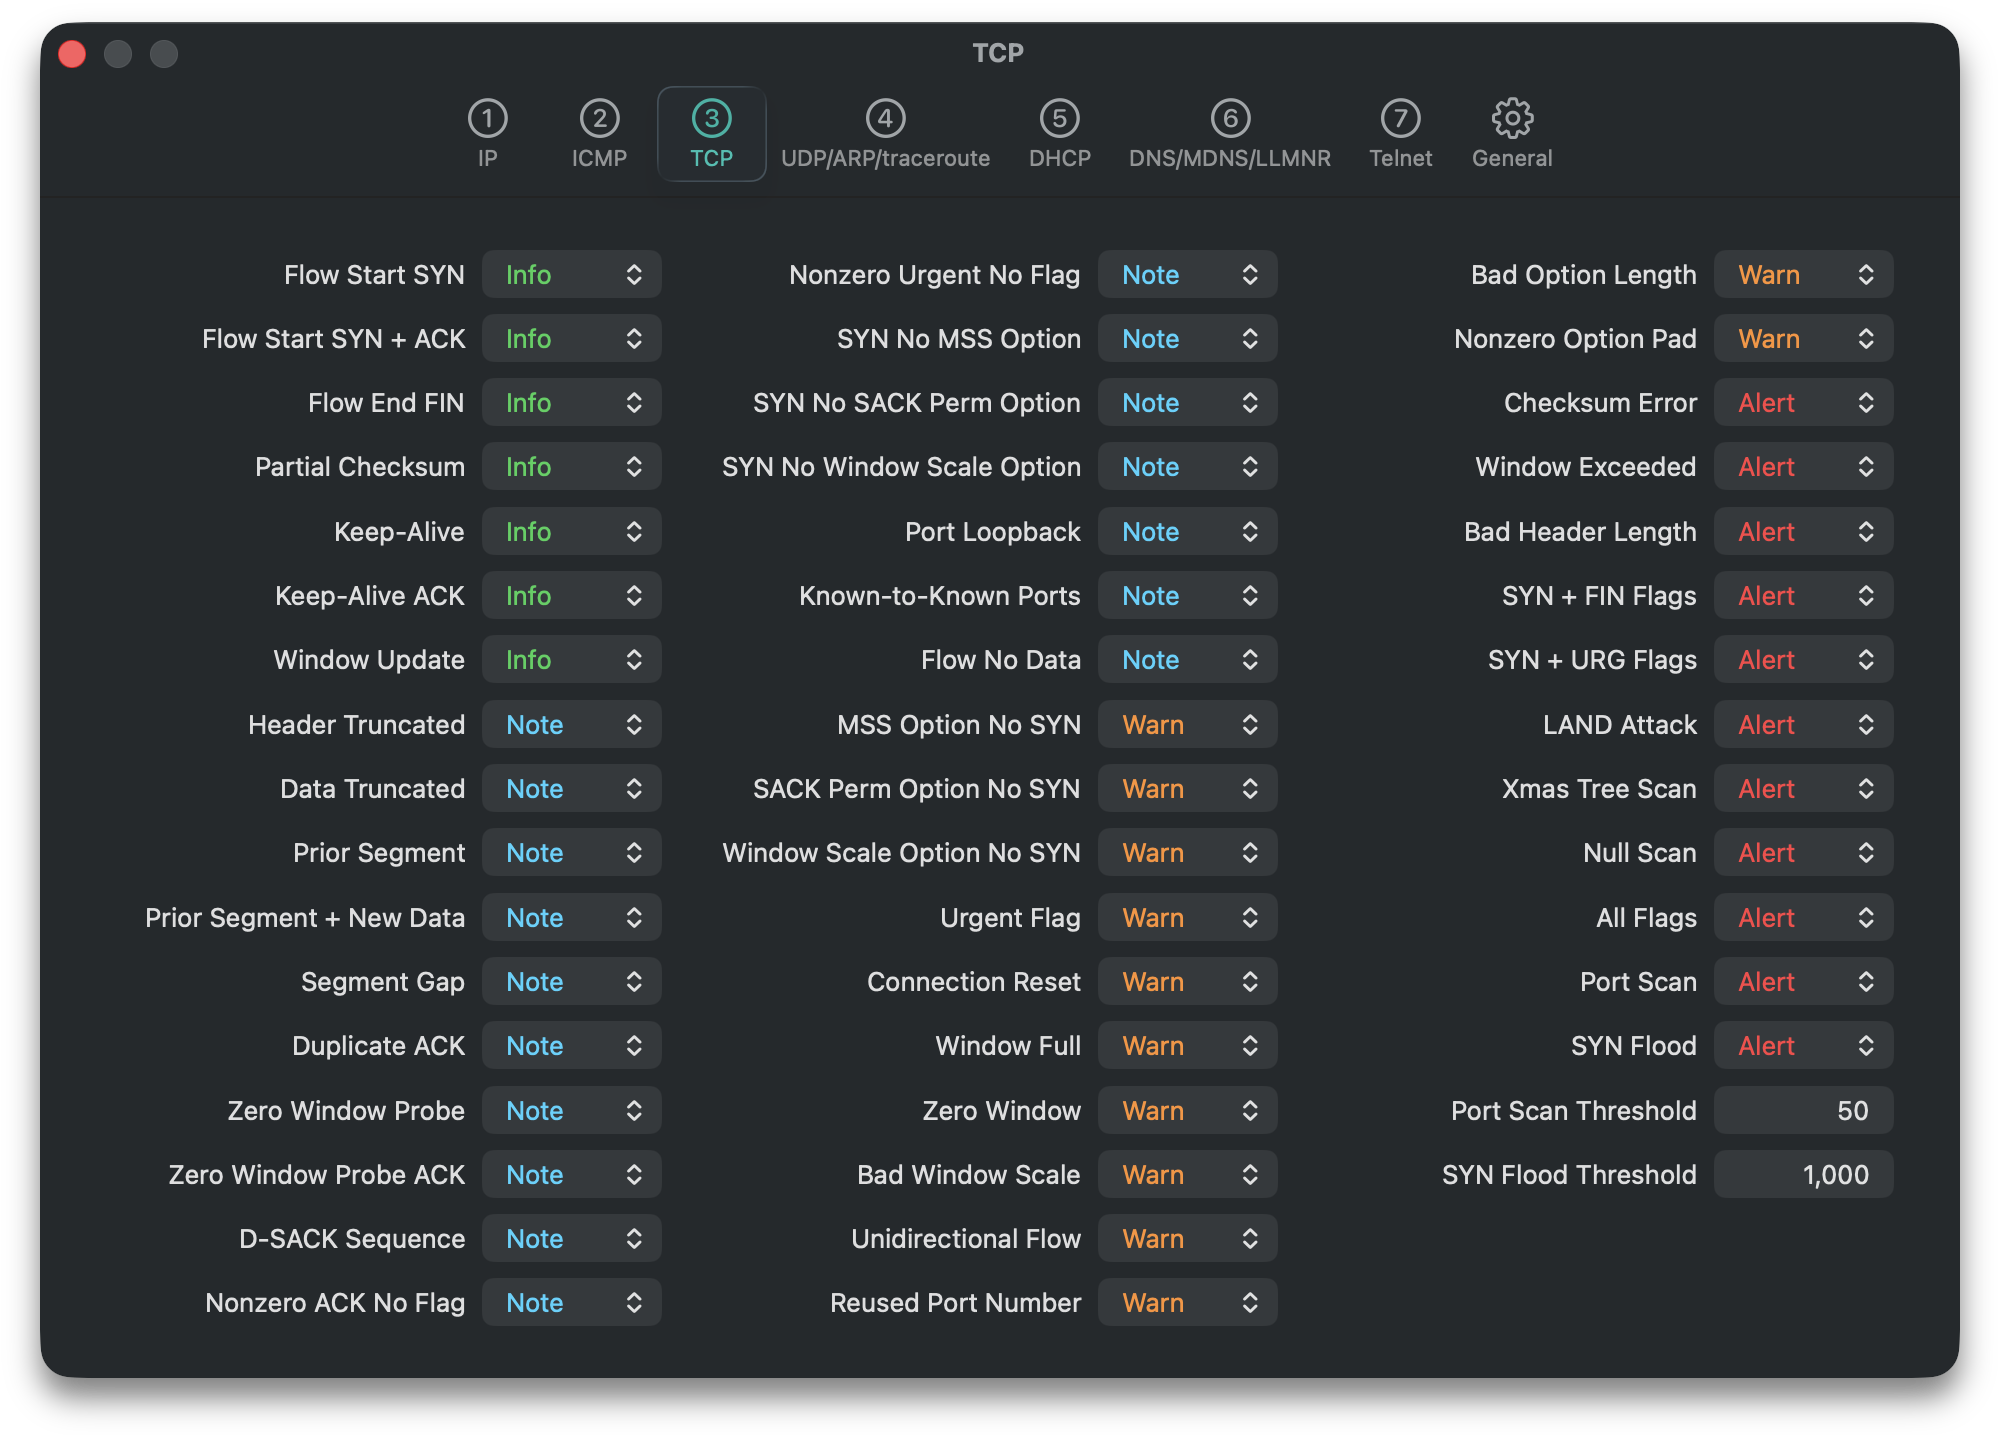
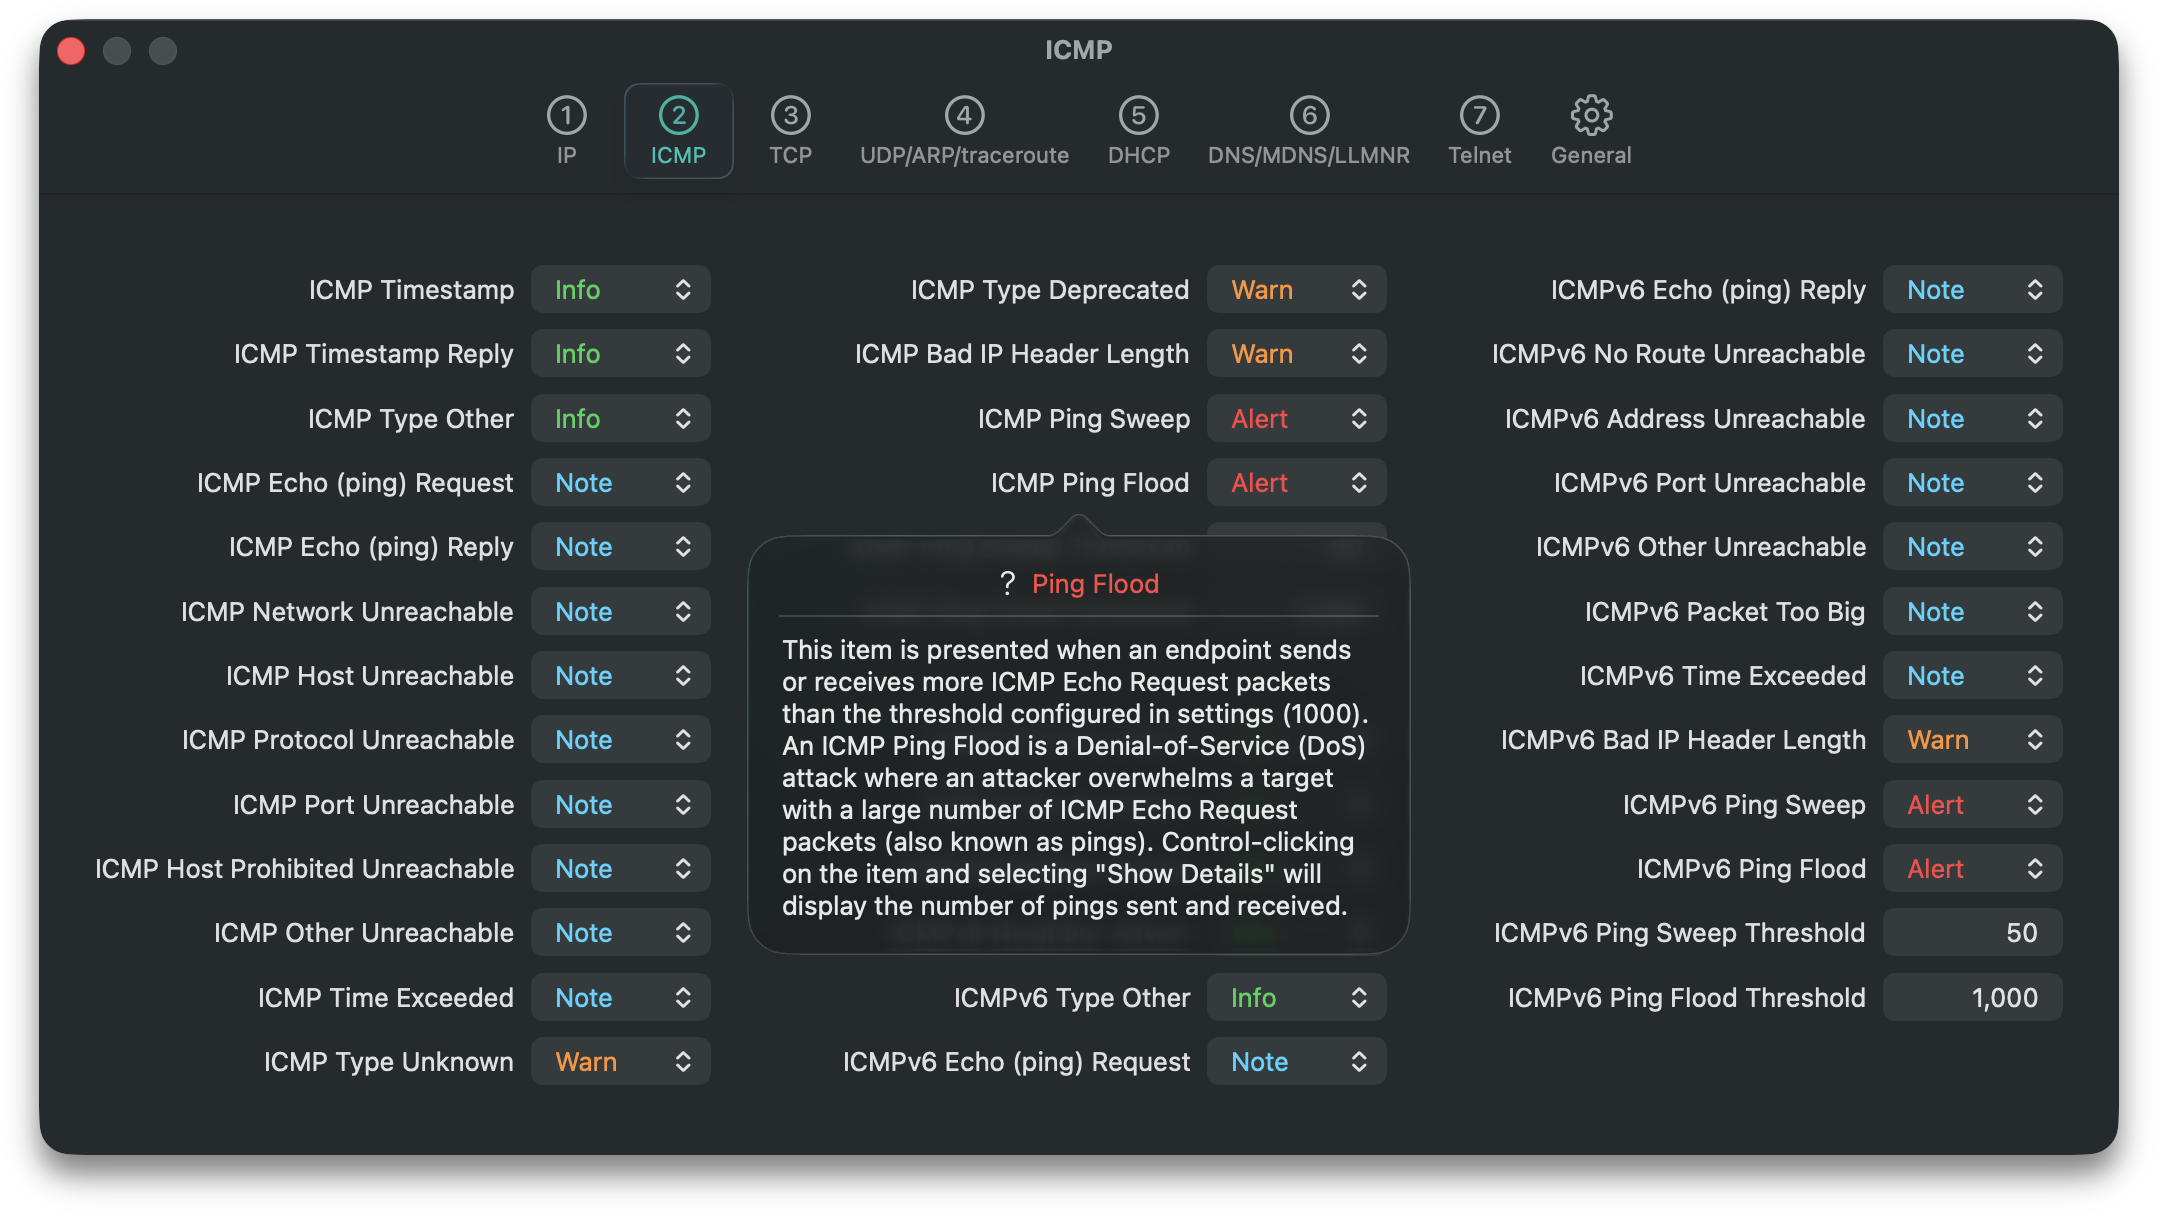
Each information element can be configured to one of four levels (Info, Note, Warn, Alert) or Disabled. Control-clicking on any information element and selecting “Show Definition” provides the rationale behind the element:
The “Show Definition” button is also available for any forensic information element displayed in a detail view:

DNS Name Mapping
DNS, MDNS, and LLMNR address records are used to map names to endpoints’ IPv4 and IPv6 addresses.
Protocol Distributions
Capture File Forensics provides 3 types of protocol distributions:
+
IP Protocols
+
Application Protocols (TCP and UDP)
+
Well-Known Ports (TCP and UDP)
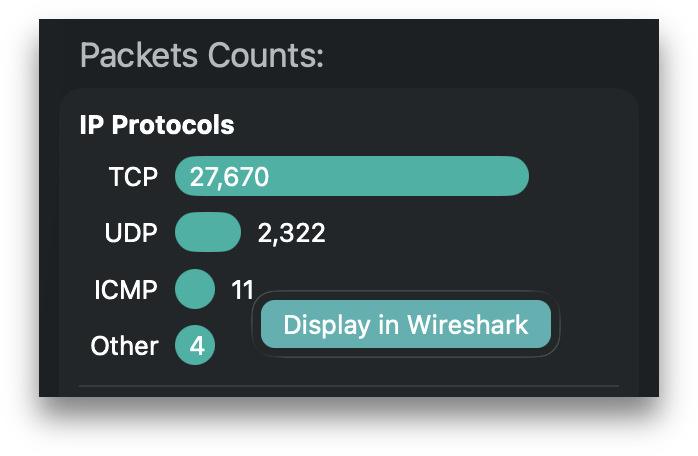
Application Protocols only counts packets for flows containing at least one data segment and uses a mix of parsing and port matching to identify application protocols. Well-Known Ports counts all packets to and from well-known ports regardless of whether protocol data is present. In the protocol distributions shown on the left, 102 well-known ports are listed, but only 6 application protocols are identified. This is explained by the Flow No Data forensic being detected on over 99% of TCP flows.
Wireshark Integration
If Wireshark is installed, Capture File Forensics can launch the currently loaded capture file in Wireshark from the following locations:
+
IP Endpoints table
+
IP Flows table
+
TCP Flows table
+
UDP Flows table
+
Protocols in Forensics list
+
IP Protocols bar chart
+
TCP Well-Known Ports list
+
UDP Well-Known Ports list
+
Protocols in Forensic Column Filter popover
Control-clicking on an element in these locations and selecting “Display in Wireshark” launches the app with the appropriate display filters for the packets associated with each location.
Capture File Forensics also provides
+
Capture File Overview
+
IP Address table filter
+
Flow drill down by forensic item
+
Set table forensic column to any forensic item
About the developer
The developer of Capture File Forensics has been writing network analysis software for 40 years. It started at Bell Labs with protocol decodes for Excelan LANalyzer capture files. A few years later, they founded Legend Software and launched the LAN Patrol Network Analyzer. That led to an acquihire at Network General Corporation, where LAN Patrol became the Sniffer Network Monitor. That was followed by significant contributions to network analysis products at Network General, Network Associates, Network ICE, Internet Security Systems, and IBM. Now, they are finally back in startup mode with Capture File Forensics. And like Al Pacino in Scent of a Woman, they’re just getting warmed up.
Thanks for checking out Capture File Forensics.